Features


 | |
 | |
 | |
 | |
 | |
 | |
 | |
 | |
 | |
 |
|
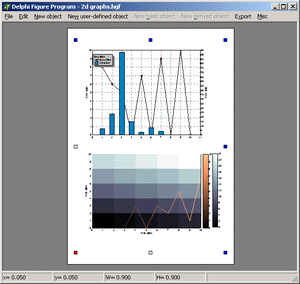
HyperGraphics consists of a rich set of logically consistent drawing objects that can be combined to produce professional engineering-quality graphics. By using a consistent object-orientated approach HyperGraphics bypasses the problems associated with using esoteric and procedurally orientated operating system procedures and functions. HyperGraphics has been optimised for speed and flexibility allowing speed critical applications to be created with ease. Key features include:
Graphing features [Back to top] HyperGraphics is excellent at drawing and manipulating engineering/real-time data. It has a myriad of different line-styles and line-markers and has powerful automatic axis labelling capabilities. There is no limit on the number of points a line can have and all x/y/z data is defined using double precision. HyperGraphics also comes with a key object that will automatically react to changes in the line styles of the lines it shows. 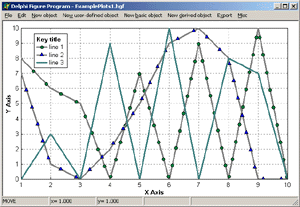
In addition to its 2D lines HyperGraphics also comes with two built-in objects for displaying z-data. A pseudo 3D-line and a pseudo 3D-matrixline. These will draw the z-data using colour to represent the third axis. A colourbar is used to show the mapping of the colours to a z-data value. A 3D-matrixline can also be drawn alpha-blended with the background using an overall value of alpha-blend or defined on a pixel-by-pixel basis. 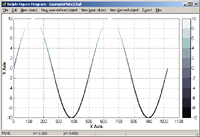
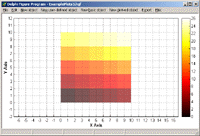
A variety of different colourmaps are available as standard providing a spectrum of colours from the minimum to maximum z-value. Alternatively user-defined colourmaps can be defined easily. Logarithmic and linear axes are supported and it can automatically show labels using exponential or standard notation. Rounded increments are chosen based on ones, twos or fives. 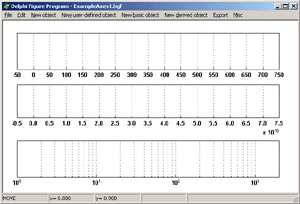
Date and time labels can also be automatically generated using increments ranging from 1 second to 100 years. Labels can also be drawn at a user-specified angle or parallel to the axis. 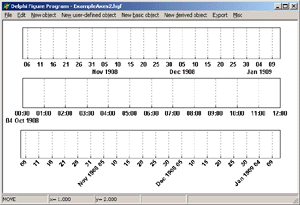
Any number of axes can be attached to a graph and they can also be aligned to the left or right or be positioned a fixed distance away from the graph. 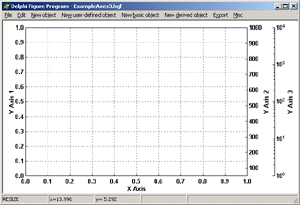
Interactive capabilities [Back to top] A powerful feature of HyperGraphics is its interactive capabilities. This allows all graphical objects to be selected, moved and resized with the mouse. The appeareance of selected objects and their interactive behaviour can all be overridden programatically. Multiple object selection with a rubber-band box is supported as are user-definable right click menus. 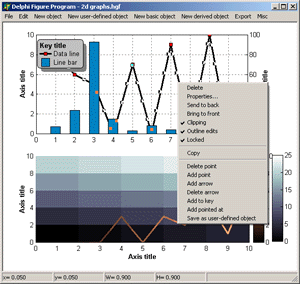
HyperGraphics comes with a separate run-time properties dialog for each graphical object. These dialogs can be accessed through a method call or via the default right-click menu. 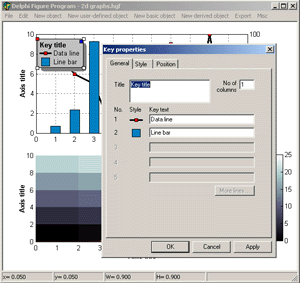
Textual content of a graph or figure can be optionally edited in place. This means that, for example, graph titles, axis labels and titles can be edited quickly and easily. 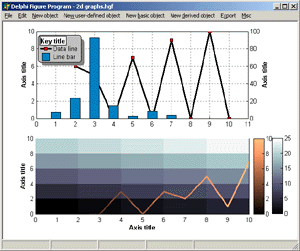
Units for positioning and sizing objects [Back to top]
All graphical objects can be positioned and sized using various units including cm, pixels, inches, points, data and normalised. Diagramming support [Back to top] HyperGraphics has excellent diagramming support using its built-in objects such as connectors, sockets, multi-line text boxes and different shapes. Connectors can have any number of arrows attached (with four different arrow heads) and can be right-angled, or be forked horizontally or vertically. Table objects are particularly useful as presenting multiple text objects and can have any number of rows and columns. Each cell of the table can act as a container for any other graphical object. The built-in text tip objects can be used to highlight important areas of the diagram. 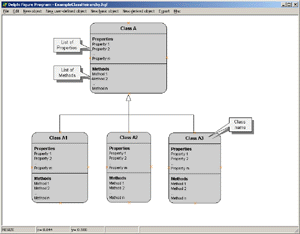
System diagrams can be easily drawn and benefit from connectors and the package's ability to attach text to connectors. 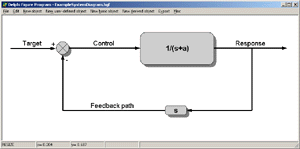
UML diagrams can be drawn with ease using the rich set of UML specific objects supplied with HyperGraphics. 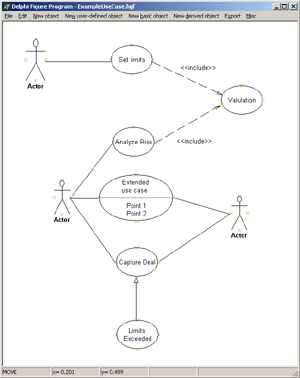
Electrical circuit diagrams can also be drawn using the supplied set of electrical objects. 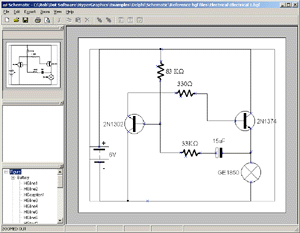
Images can be resized either using a fast delete pixels method or by merging composite pixels using averaging. They can have a transparent colour assigned to them which will mean any pixel that has this colour will be not be visible. Images can also be alpha-blended with the image's background. The amount of alpha-blend can be set to one value for the whole image or set on a pixel-by-pixel basis. 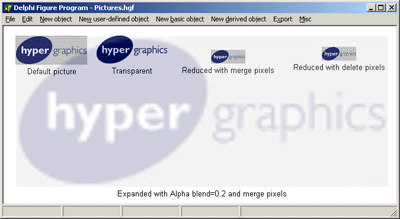
Double buffered drawing [Back to top] HyperGraphics screen output can be drawn double-buffered to produce a flicker-free display. Double buffered drawing means that the image is first drawn to memory and then the complete image is transfered to the screen. User-defined graphical objects [Back to top] HyperGraphics allows the creation of user-defined graphical objects that can have their behaviour overridden to provide any functionality that is not provided by a standard object. Brand new objects can also be created by combining instances of other existing objects and modifying their combined behaviour. 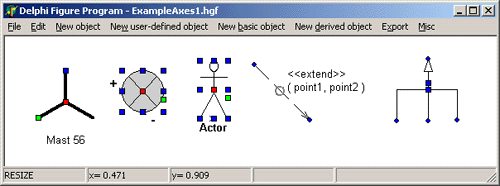
The open and flexible way that HyperGraphics has been designed means that the possibilities of what user-defined objects can do is almost limitless. In an extreme case the user can override the draw event for an object and use direct Windows API calls to create the object they want. Object serialisation [Back to top] All graphical objects can be serialised to a buffer which allows cut, paste and undo operations to be easily implemented. Complete object heirarchies can also be serialised meaning that completed figures and plots can be saved to file. The open nature of HyperGraphics design means that any user-defined properties can be easily written to this buffer and all overriden behaviour can be restored when the object is re-created from the buffer. Printing support comes built-in with HyperGraphics meaning that a figure or plot can be sent to the printer with a single method call. In addition it has print preview support allowing the plot to be seen as it would appear on the paper. Figures and plots can also be exported as bitmaps or enhanced metafiles allowing them to be easily incorporated into word processing packages such as Word ®. 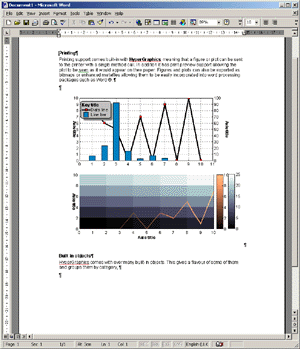
Built-in objects [Back to top] HyperGraphics comes with over many built-in objects. This gives a flavour of some of them and groups them by category,
|

Copyright © Dot Software Ltd 2008. |

