|
The following example programs are included with evaluation copies of HyperGraphics.
Note : Evaluation versions include source code for example programs written in the particular evaluation version language. For example, the Visual Basic examples source code
is included in the Visual Basic evaluation version. However, all example programs are included as executable files so you can run them without needing the
relevant development environment.
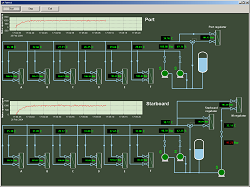
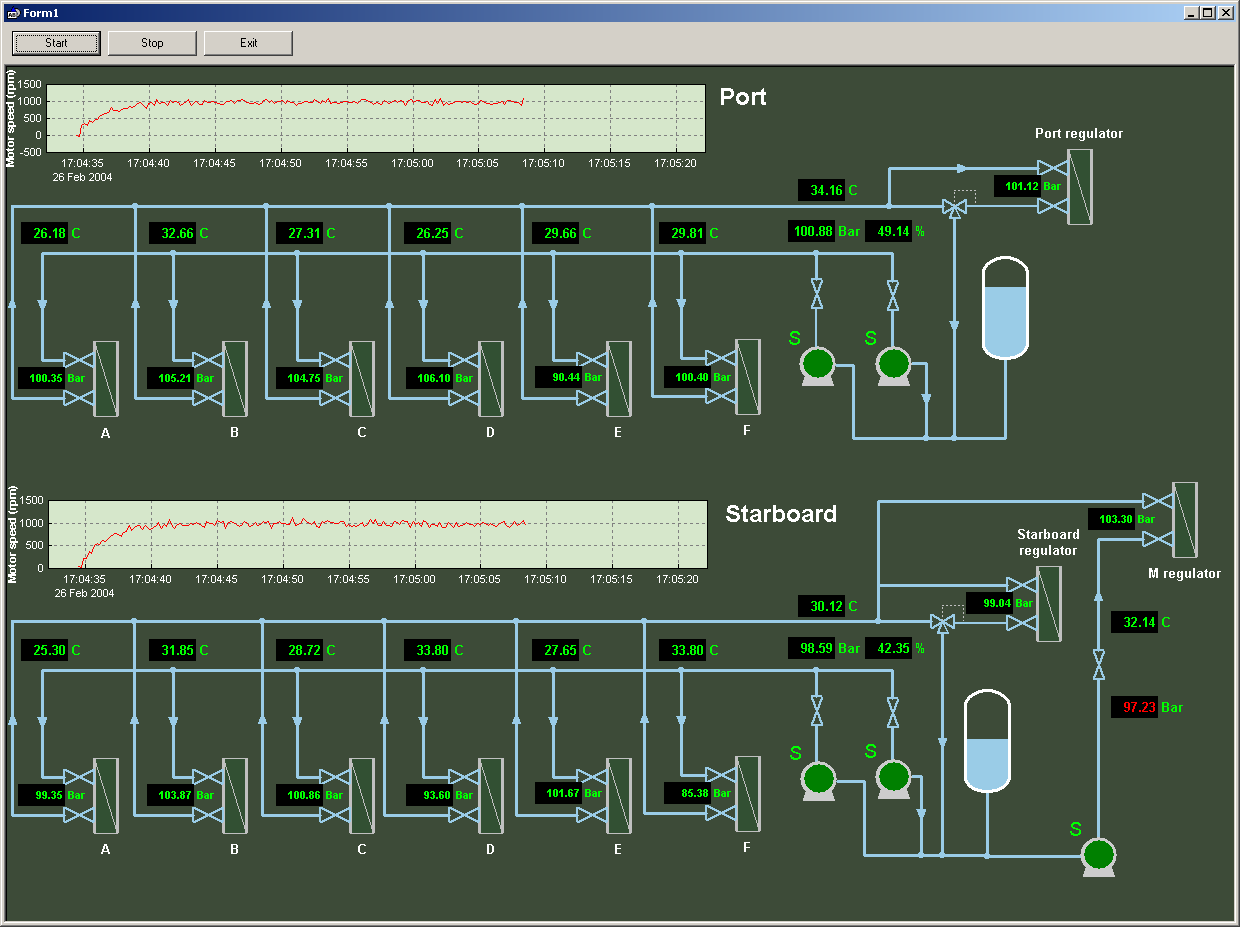
Process Control Example
This example is written in Delphi.
The program gives a demonstration of how HG can be used in a process control environment. The display was designed in Schematic
(see Schematic web site for details) and was pasted into the form file.
At run time the graphical objects are loaded with real-time data.
|
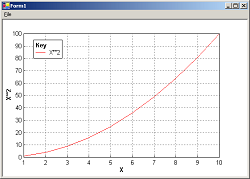
VBDemo Example
This example is written in Visual Basic .NET.
The program gives a demonstration of a very simple X-Y plot using the .NET interface. Any plotting application in .NET can use this example as the starting point.
The graph data is loaded from a text file, so despite its simplicity the program is already a useful plotting tool.
|
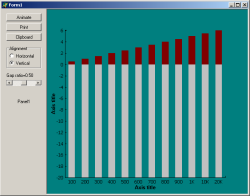
Bar Graph Example
This example is written in Delphi.
The program draws a bar graph. The user can change the orientation (horizontal or vertical), change the width of the "bars" and animate the display.
The example shows how to draw a bar graph, change its orientation, and also shows the drawing speed of HyperGraphics.
|
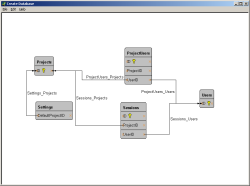
Create Database Example
This example is written in Delphi.
The program allows the user to add and position database tables in the client area. The tables can fields added to them. The user can then add
constraints and link them between the fields. The completed diagram shows the structure of the database, and this can be output to a text file
or saved as a HyperGraphics format file.
The example shows how to use connectors and table components, how to derive
components, and how to serialise derived components.
This example is also the subject of an article, which can be downloaded here.
|
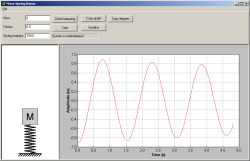
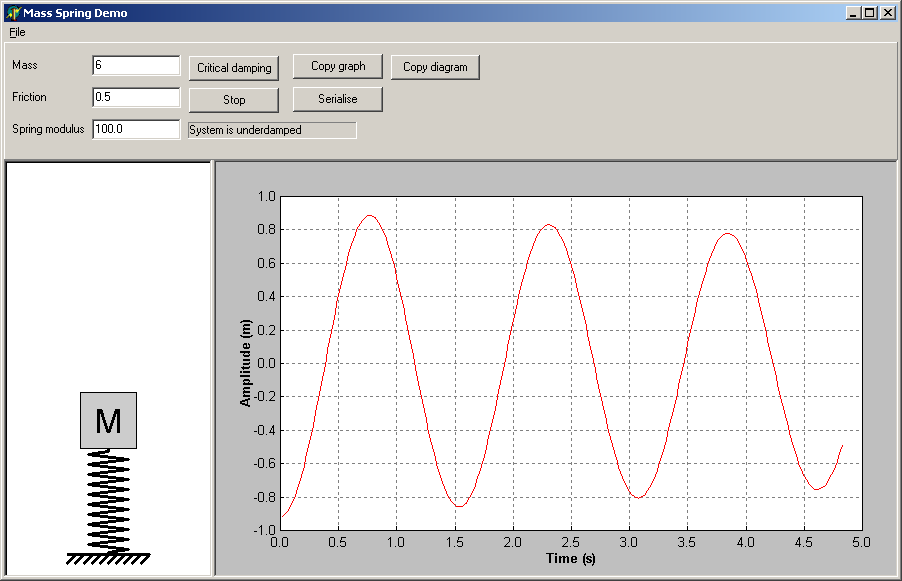
Mass Spring Example
This example is written in Delphi.
The program shows a diagram of a "mass" and "spring", and a graph. If the mass is clicked, moved up or down and then released it is
animated to show the real-time motion. At the same time the graph will show a moving trace of the motion. The properties for mass, friction and
spring modulus can be changed and the motion of the new system can be seen by moving the mass again.
The example shows how to derive new objects and serialise them, how to use the mouse and selection events, and how to update graphs in real-time.
It also shows how to save enhanced metafiles to the clipboard.
|
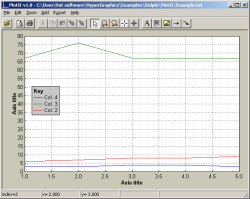
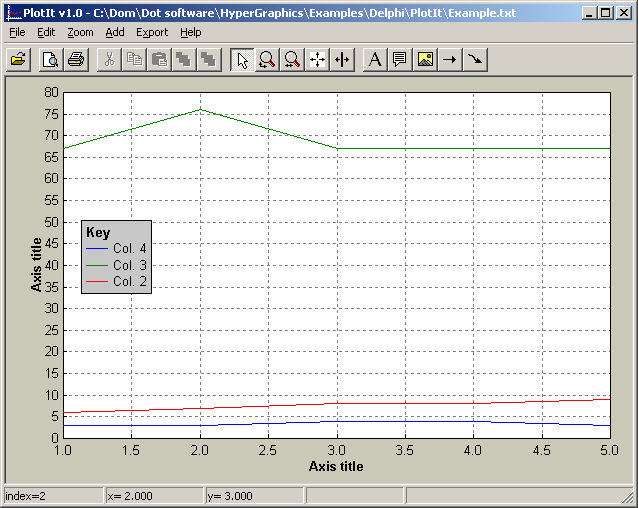
Plot It Example
This example is written in Delphi.
The program is a general purpose graphing tool allowing ASCII files (csv, txt and prn e.g. from Excel) to be plotted and annotated. The files need to be formatted
as a set of columns, the first being X, the second Y1 and so on (some example files are included). The resulting graph can be annotated by using the
toolbar to add arrows, pictures and text boxes. The graph can then be printed and/or exported to an enhanced metafile. There is also a print preview window
allowing the graph to be positioned and sized on the paper.
The example shows how to draw graphs, use the default mouse editing and use the mouse to zoom. It also shows how to use the print preview window, printing, and copying to enhanced metafiles.
|
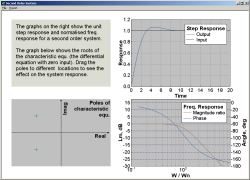
Second Order System Example
This example is written in Delphi.
The program shows the response of a second order system. The three graphs show the step response, the frequency response and the position of the poles
of the characteristic equation. The poles can be dragged with the mouse, and the two other graphs show the response in real-time.
The example shows how to use the Delphi component, how to draw graphs, and how to use mouse events. It also shows how to use the print preview window, printing, and copying to enhanced metafiles.
|
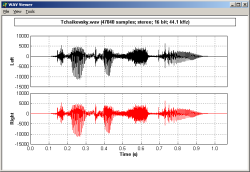
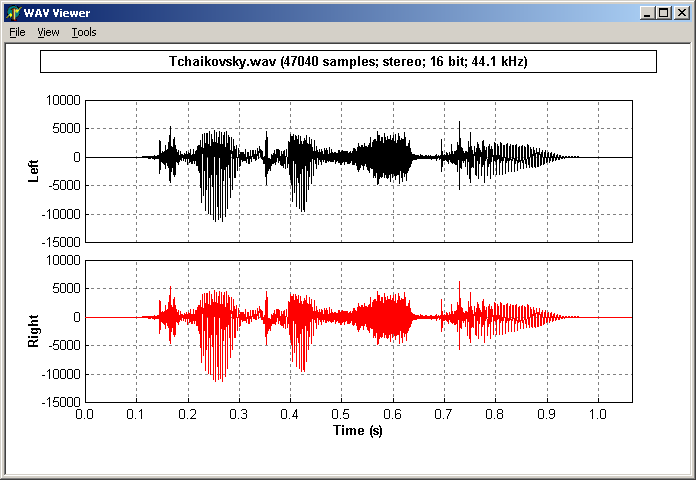
WAV Viewer Example
This example is written in Delphi.
The program displays and plays WAV files. When a file is opened the left and right channels are displayed. Selecting play from the menu will play the file
while showing the progress through the file. The X-axis can be zoomed using the mouse (and auto scaled using the View->Zoom out menu item).
When using large WAV files the program demonstrates the graphics drawing speed of HyperGraphics (using optimised drawing when there are more data points than
pixels).
The example shows how to use the Delphi component, how to draw graphs, and how to use mouse events. It also shows how to use the print preview window, printing, and copying to enhanced metafiles.
This example is also the subject of an article, which can be downloaded here.
|

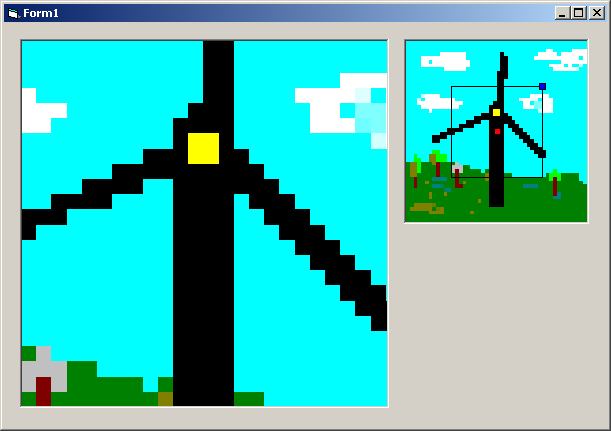
Bitmap Zoom Example
This example is written in Visual Basic.
The program displays a bitmap on the left and a zoom box on the right. The bitmap can be zoomed and panned by resizing and dragging the
square in the zoom box. The example demonstrates flicker-free drawing, and that HyperGraphics is capable of zooming a bitmap until one pixel is occupying the
whole display.
The example shows how to load and zoom bitmaps.
|
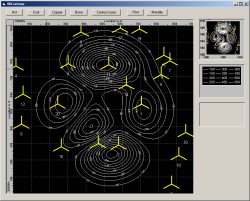
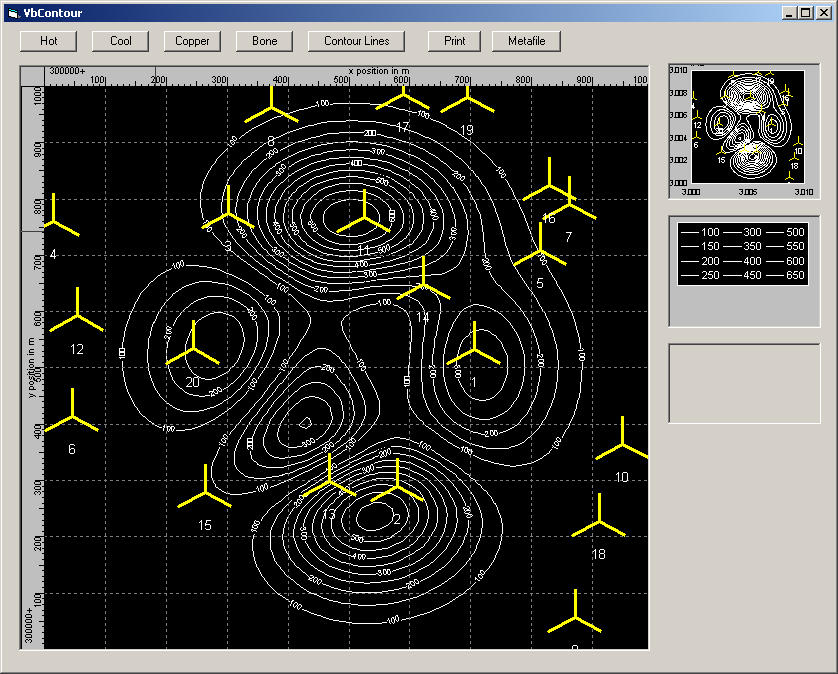
Contour Example
Two version of this example are available, written in Visual Basic and Visual Basic .NET.
The program displays a contour graph with some "wind turbines" and a zoom box. The normal axes have been overridden to display a grid with cross
hairs. The wind turbines can be selected, moved, rotated and resized. The contour lines can display height labels or a colour map.
The example shows how to override component behaviour (for the wind turbine, axes and contour lines) and how to copy
a window to the clipboard.
|

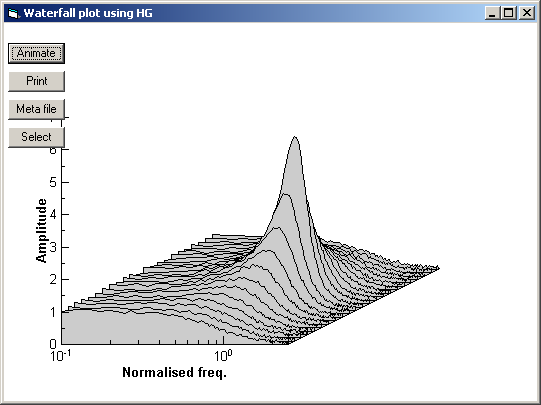
Waterfall Example
This example is written in Visual Basic.
The program displays a waterfall plot. Pressing the Animate button displays a changing set of data. The Select button selects the graph and
allows it to be moved, resized and the projection angle changed.
The example shows how to create a waterfall plot and demonstrates the drawing speed of HyperGraphics.
It also shows how to copy a window to the clipboard or printer.
|

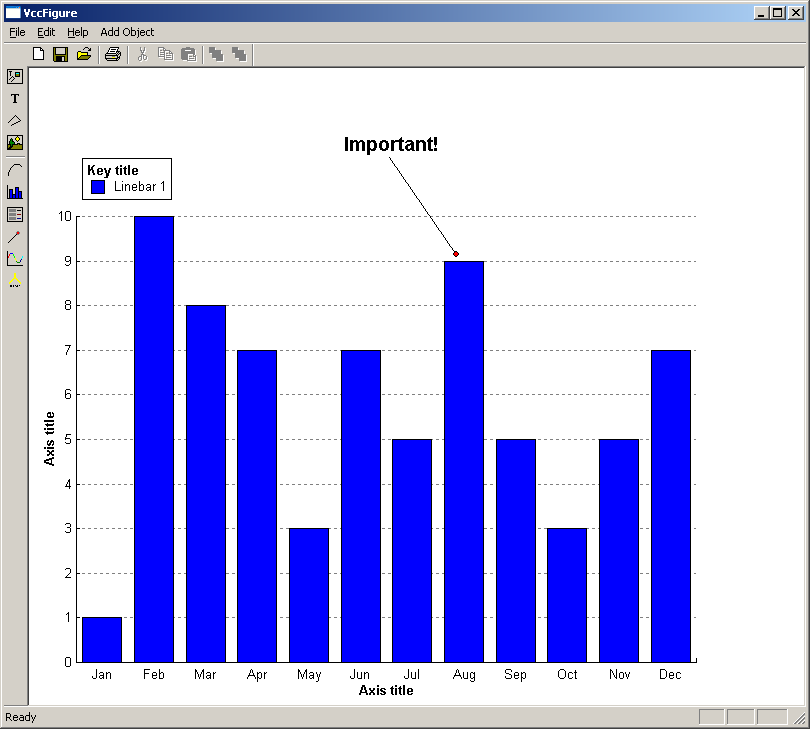
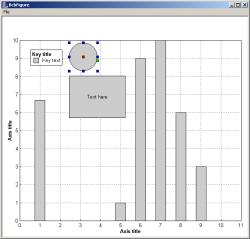
Visual C++ Figure Example
This example is written in Visual C++.
The program allows a figure to be drawn by adding HyperGraphics objects to a window. The program can save, load and print figures, and also has a print
preview window.
The example shows how to use HyperGraphics with Visual C++.
|
Borland C++ Builder Figure Example
This example is written in Borland C++ Builder.
The program allows a figure to be drawn by adding HyperGraphics objects to a window. Use the File->Add menu item to add objects.
The example shows how to use HyperGraphics with Borland C++ Builder.
|
|