Applications


These screen shots are examples of real applications that have used HyperGraphics as their graphics engine.

Figure 1 - Wind Farm Analysis

This application simulates and analyses wind turbine farms. The main display shows the location of each wind turbine along with expected wind contours and height contours. Each turbine can be individually selected, moved and have various properties changed. The small window in the top-right corner is a zoombox that allows the user to pan and zoom the main window.

HyperGraphics was chosen to do the graphics since it was an event-driven, object-oriented library. This allowed the developers to have a very clean and flexible design for the graphics sub-system. The developers particularly liked the way that custom graphics objects could be easily created and the excellent support HyperGraphics had for user-interaction.


Figure 2 - Real time data display

This is an application that plots data from a test rig in real time. The application runs on a remote PC and connects to the test rig via a TCP port. The test rig can output about 120 channels of data, and includes a time base. The application stores the graph properties (channels, colours, position/size of window etc) in a database, and a set of graphs can be grouped into a "test set-up". This allows the application to show the relevant graphs for each type of test automatically.


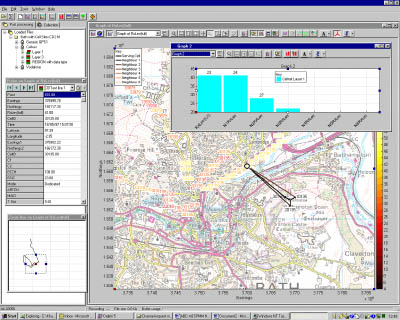
Figure 3 - Data Presentation and Analysis

This screenshot shows an application for presenting data from mobile network coverage tests. The application is showing two graphs:
1. a bar graph of the mobile Rx Level with BSIC shown numerically.
2. a route map of the test showing the Rx Level in colour with the Cell ID shown numerically.

On the route map the point with the black circle round it is the position of the Probe (the Probe window is shown at the top left). The base stations are also shown in the plot, with the solid lines connecting the Probe point to the base station showing the serving cell and neighbours 1 and 2. The Zoom box (shown at the bottom left) allows the user to pan and zoom using the mouse. Auto-scaling of the axes is also provided.

This application can also collect data from numerous devices (phones, scanners, GPS etc), and shows similar plots in real-time. The configuration of the application can also be saved, allowing previous graphs to be reloaded.