Delphi


 | |
 | |
 | |
 | |
 | |
 | |
 | |
 | |
 | |
 |
|
Using THGPanel at design-time When a THGPanel is added to a form at design-time, it appears as a blank panel. The THGPanel's appearance is controlled in two ways: - Setting the component's properties in the object inspector. - Using the HyperGraphics Designer to build up a collection of HyperGraphics objects in the THGPanel and set their properties. THGPanel properties Key design-time properties of THGPanel are: MouseEditing controls whether the user can interact with the HyperGraphics objects at run-time. PopUpMenu defines a user defined pop-up menu activated by right-clicking the panel. Note that when MouseEditing is True, the pop-up menu appears only when a HyperGraphics object is selected; if PopUpMenu is not assigned, a default HyperGraphics pop-up menu is used. OnContextPopup allows you to customise the default pop-up menu behaviour. A handler for this event will be called before any menu is displayed. For example, to suppress the pop-up menu when MouseEditing is True, set the Handled parameter True. The HyperGraphics Designer The Designer window appears to the left of the form whenever the THGPanel is selected. If the Designer becomes hidden, you can make it reappear by right-clicking in the THGPanel and selecting 'HyperGraphics Designer...' from the pop-up menu. 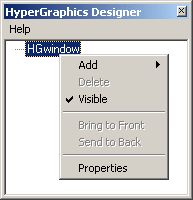
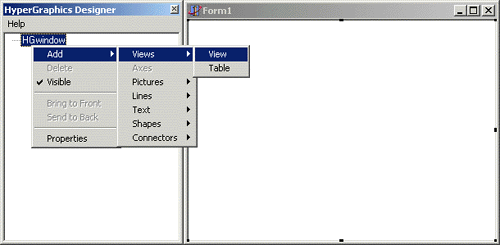
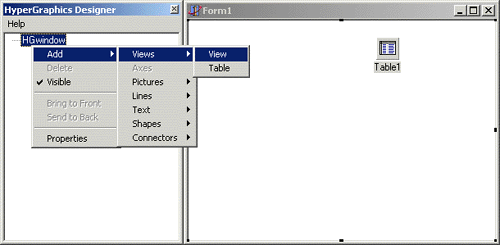
Inside the Designer window is a tree view that shows the HyperGraphics objects defined for that THGPanel. When the THGPanel is first placed on the form a single THGWindow object forms the base of the tree. By adding HyperGraphics objects to this window and adding objects to those objects and so on, a complex graphical hierarchy can be built up. When you select an object in the tree, it appears selected on the THGPanel (unless its Visible property has been set False) and vice-versa. The objects in the tree are manipulated using a right-click pop-up menu with the following options: - Add a new child object to this object. - Delete this object. - Visible: show or hide this object. - Bring to Front: show this object on top of all the others. - Send to Back: show all other objects on top of this object. - Properties: show a property page to set up the appearance of this object. The HyperGraphics objects are given names automatically when they are added to the tree. These names can be used in the code because references are automatically generated. The name can be changed by clicking once on the selected object and typing the new name. Example - a simple graph - Put an THGPanel on a blank form (from the HG page of the component palette). - In the object inspector, set the THGPanel's Align property to alClient. - Show the HyperGraphics Designer by clicking on the THGPanel, or by right-clicking it and selecting 'HyperGraphics Designer...' from the pop-up menu.
- Add a HyperGraphics view object to the THGPanel's window object (called HGwindow1).
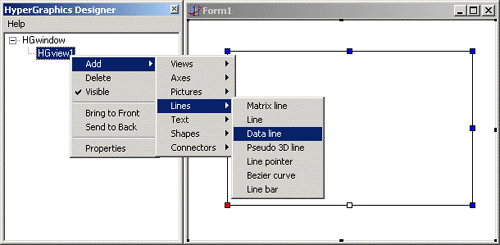
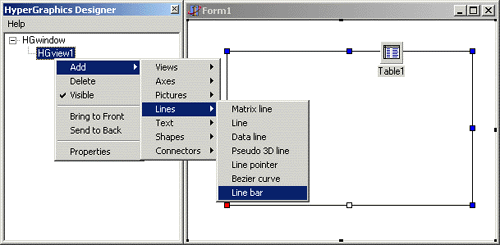
- Add a HyperGraphics data line object to the view object.
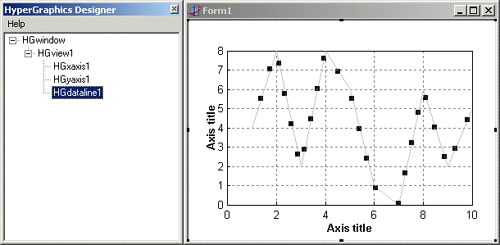
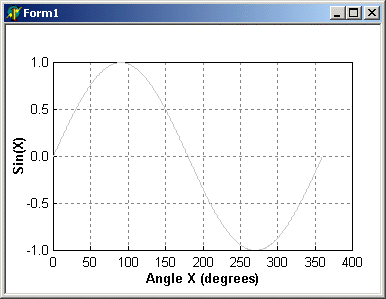
Note that a set of x and y axes were added automatically, because the data line object uses data units. Initially, the data line object displays some dummy data. Now by changing some properties and with a small amount of code the running application can display your own data. In this example we'll display a sine wave. First we need to set some meaningful axis labels: - Click on the x axis title in the panel. An edit box should appear around the title. Type in 'Angle x (degrees)' then click outside the edit box. - Repeat the above for the y axis title. Type in 'Sin(x)'. Note that the vertical y axis title is entered horizontally. Now we can enter the code: - Add HGClasses and HGapi to the uses list for the form. - Double-click the form's OnShow property value in the object inspector to generate a FormShow event handler. - Type (or copy and paste) the following code:
procedure TForm1.FormShow(Sender: TObject);
var
  I: Integer;
begin
  // plot sin(X) for 0<X<360 degrees
  with HGdataline1 do
  begin
    Npoints := 361;
    for I := 0 to 360 do
    begin
      XData[I+1] := I;
      YData[I+1] := Sin(I*Pi/180);
    end;
  end;
end;
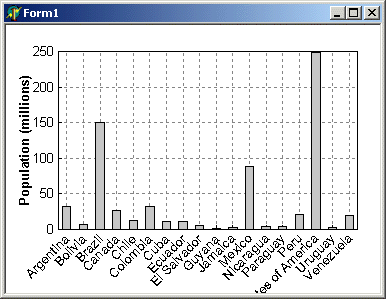
Run the example application... Example - a database bar graph - Put a TTable on a blank form (from the Data Access page of the component palette). - Put an THGPanel on the form (from the HG page of the component palette). - In the object inspector, set the THGPanel's Align property to alClient. - Show the HyperGraphics Designer by clicking on the THGPanel, or by right-clicking it and selecting 'HyperGraphics Designer...' from the pop-up menu.
- Add a HyperGraphics view object to the THGPanel's window object (called HGwindow1).
- Add a HyperGraphics line bar object to the view object.
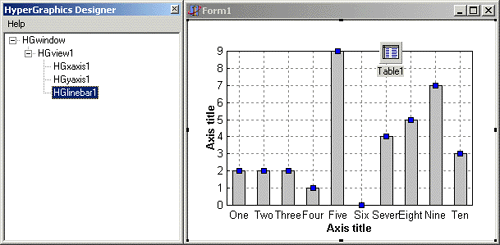
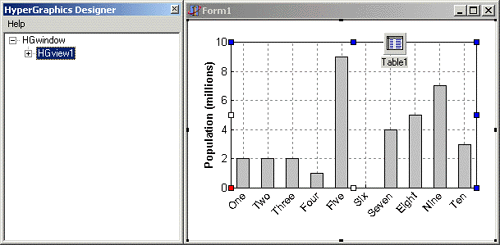
Note that a set of x and y axes were added automatically, because the line bar object uses data units. Initially, the line bar object displays some dummy data. Now by changing some properties and with a small amount of code the running application can display your data. In this example we'll display some data from the Delphi DBDEMOS database. First we need to connect to the database: - Select the Table1 component in the object inspector. - Select DBDEMOS for the DatabaseName property. - Select country.db for the TableName property. - In the Fields Editor, add the Name and Population fields. - Set Table1.Active to True in the object inspector. Then we need to set some meaningful axis labels: - Click on the y axis title in the panel. An edit box should appear around the title. Type in 'Population (millions)'. Note that the vertical y axis title is entered horizontally. - Select HGxaxis1 in the HyperGraphics Designer tree view, right click and select Properties. - Delete the title text and set the property LabelAlignment to the value HG_PERPENDICULAR. - Select HGview1 and drag the red selection handle upwards to make some more space for the x axis labels.
Now we can enter the code: - Add HGClasses and HGapi to the uses list for the form. - Double-click the form's OnShow property value in the object inspector to generate a FormShow event handler. - Type (or copy and paste) the following code:
procedure TForm1.FormShow(Sender: TObject);
var
  I: Integer;
begin
  with HGlinebar1 do
  begin
    Npoints := Table1.RecordCount;
    Xaxis.NLabels := Npoints;
    Table1.First;
    for I := 1 to Npoints do
    begin
      Xaxis.LabelPositions[I] := I;
      Xaxis.SetLabel(Table1Name.AsString, I);
      Data[I] := Table1Population.AsFloat/1000000;
      Table1.Next;
    end;
  end;
end;
- Run the example application... Using THGPanel at run-time Key run-time properties of THGPanel are: HGWindow is the main HyperGraphics window object that is created with the panel. The HGWindow property can be passed to routines that require a THGWindow reference. It can also be used to change, programmatically, the properties of that window. |

Copyright © Dot Software Ltd 2008. |
