|
Graphs can be easily constructed and incorporated into Schematic diagrams. Data can be defined interactively, read from a text file and also edited via a spreadsheet style dialog box. Data can be shown as data lines or line bars.
Schematic's graphing features,
 |
Axes can auto label and auto scale themselves using rounded limits.
|
|
X-axis labels can be drawn parallel or at an oblique angle to the axis line.
|
|
Linear and logarithmic axes.
|
|
Full control over axes label fonts/fontsizes and colour.
|
|
Includes an automatic key that updates itself as data lines are edited, added and removed.
|
|
Multiple y-axes which can be aligned to the left or right of the graph and also positioned away from the graph
|
|
No limitation to the number of data lines and line bars. Can mix data lines and line bars on the same graph.
|
|
Many varied line styles including different shaped and coloured markers.
|
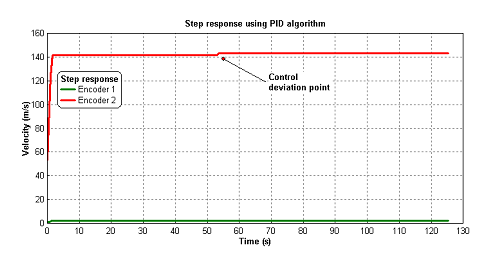
A data line graph |
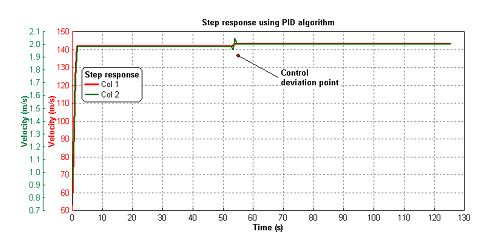
A multi-axis data line graph |
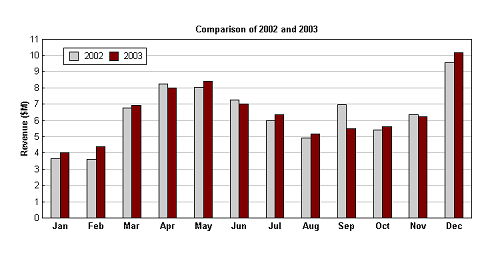
A line bar graph |
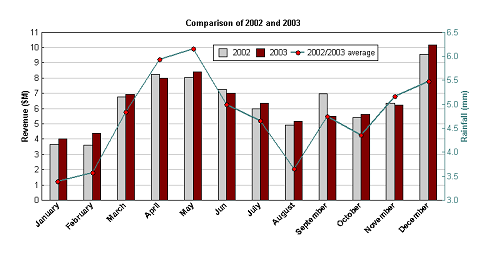
A multi-axis line bar and data line graph |
|
